Facebook vs. Google Analytics
Why Facebook Clicks & Google Analytics Don't Match
WHAT COURSE ARE YOU LOOKING FOR?
-
Facebook vs. Google Analytics
5 Apr 2023Why Are Facebook and GA Metrics Different?
Understanding the data from your Facebook posts or Ads is important for you to be able to make the right decisions. But this can be difficult when the metrics shown in Facebook are completely different to what you see in your Google Analytics. Which one should you trust?
At the moment people have a lot of questions about Google Analytics, which isn’t surprising as many people are adjusting to the new layout and way of working of GA4.
But one long-standing question people have had while using Universal Analytics and still have after switching to GA4 is “Why are my Facebook clicks and conversions so much higher than what is reported in Google Analytics?”.
In this article we will explore the reasons behind this data discrepancy, so you can better understand what is happening, evaluate your social media campaigns better, and make more informed decisions.
Facebook vs. Google
When you compare Facebook reports (or Instagram) and Google Analytics reports, the numbers usually look very different.
Some people think Facebook overcounts clicks and conversions to make themselves look better while others believe that Google is undercounting clicks to make Facebook paid and organic traffic look worse than it is.
Whilst there is no love lost between Google and Facebook, neither of these theories are really true!
So, why is there such a difference in the data between your Facebook reports and those in Google Analytics?
What are the real reasons for the figures in the two platforms not matching? Well, as you might have guessed, there are numerous reasons
Here are some practical and technical reasons why the numbers are not the same in your Facebook reports and your Google Analytics (GA4) reports.
Facebook Clicks vs. Facebook Link Clicks
Firstly, you should make sure you are looking at the right metrics.
On Facebook, you will see two metrics “Clicks” and “Link Clicks” for ads.
“Clicks” include every interaction on an ad, such as like, share, or link click, for example.
If you want to see how many people clicked on a link to your website, you need to look at “Link Clicks”.
In Google Analytics, you will see reports on the Facebook users that came to your website, so therefore you will need to be looking at “Link Clicks” rather than “Clicks”.
You would think, then, that the number of "Link Clicks" from an ad would match the number of sessions reported in GA - or at least be pretty close.
However, it is very common to see the number of "Link Clicks" reported in Facebook is much higher than the reported number of sessions in Google Analytics.
Here is a list of the reasons why this happens:
7 Reasons Why Facebook Clicks & GA Sessions Don't Match
1. You can click on a Facebook post or ad by mistake.
In this case, you would be quite likely to close the browser before the page loaded, so Facebook would record a 'link click' but GA would not record a session.2. You can click on the Facebook link/ad multiple times
Perhaps you are on your phone and the connection is slow, so you click again – 2 clicks - but only one session in GA.3. You click on a link in a Facebook post or ad, but you don’t allow cookies
For Google Analytics to record a session you must allow cookies.4. You don’t have JavaScript enabled
You don’t need JavaScript to be enabled to click on a Facebook post or ad – but Google Analytics does require JavaScript to be enabled. Around 1.1% of people don’t have JavaScript enabled.5 You clicked on a Facebook post or ad, but the website didn’t load
In GA4 a session-start event only occurs on page load.
The GATC code has to be triggered. If there was an issue with your server. e.g. your site was down or the page load speed was very slow, a Facebook click may not end up with a session.6. You may not see all your Facebook traffic in one Source or Medium in GA reports
When looking at your acquisition reports in GA, you should be aware that Facebook (and Instagram) traffic is not reported as one source.
For example, you will see:- .facebook.com
- l.facebook.com
- m.facebook.com
- lm.facebook.com
Obviously, you will need to look at all of these to see how much traffic you are getting from Facebook.
You will also see Facebook traffic reported as Social and as Referral traffic AND Direct - see below.
7. App traffic is often shown as Direct
Perhaps. the least known, but probably the biggest issue with tracking Facebook traffic in Google Analytics, is that mobile apps often don't pass parameters.
So someone clicking on an ad on their Facebook mobile app will not have any source/medium data stored in their browser.
This means Google doesn't know where the traffic comes from. Even if you use UTM tracking.
If Google Analytics can't find a source or medium, this traffic gets reported in Direct.
Why are Facebook Conversions Higher Than In Google Analytics?

To report on website conversions in Facebook reports you must add the Facebook pixel to your website and configure it to report on conversions.
When you have done this you will inevitably see Facebook reporting higher conversions from its ads than Google Analytics does.
This is due to a number of reasons:
- - Because not all traffic from Facebook is attributed to Facebook - see 3,4,6 & 7 above
- - Also, Facebook uses a different attribution model - see below.
Facebook and Google Analytics Use Different Conversion Attribution Models
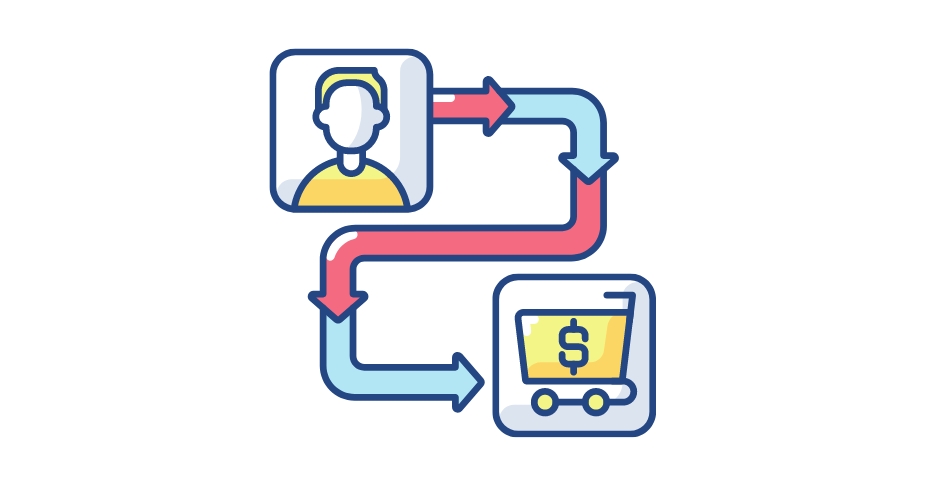
Facebook uses a 7-day look-back window for click-through conversions, PLUS a 24-hour window for view-through conversions.
This means that when you click on an ad on Facebook, go to a website and don’t convert, but then you return any time in the next 7 days and then convert (on the same browser), you will be counted in Facebook as a Facebook Ads conversion (click-through conversion).
If you simply view the ad and then go to the website anytime within 24 hours you will also be counted in Facebook reports as a conversion (view-through conversion).
In Google Analytics 4 no ‘view through conversions’ will be counted as a Facebook conversion.
Also, Google Analytics 4 uses a Data-Driven attribution model which most commonly attributes conversions to the ‘last click’.
So, Facebook is counting people who click on a Facebook ad and convert anytime in 7 days or view an ad and convert in one day.
Whilst GA will usually only count conversions when users click on a Facebook ad and then convert on the session following the click.
Please check your conversion paths and attribution reports in GA4 to find out more.
Annoyingly, Facebook doesn’t differentiate between Click-through conversions and View-through conversions in its reporting. However, you can remove ‘View-Through’ conversions in Facebook.
User Tracking is Different on Facebook and Google Analytics

Another thing to consider when analysing your Facebook Ads Manager reports, with the reports created by Google Analytics, is that Facebook tracks people using their User ID rather than cookies and tags.
Imagine that you go to Facebook on your mobile and click on an ad, and then later on you go to Facebook on your PC and click on an ad, Facebook would know you were the same person. Google, however, would treat this as two separate users, unless you were signed into Google with Ads personalisation switched on.
So, in this example, Facebook would report a better conversion rate, see below for why:
- - Google would report 2 users and 2 sessions and 1 conversion - with 50% Session Conversions Rate, 50% User Conversion Rate)
- - Facebook Ads report would report 1 user, 2 link clicks and 1 conversion = 100% conversion rate
What Can You Do?
Many marketers and data analysts fail to take into account or don’t understand the discrepancies between Facebook/Instagram and Google Analytics reporting.
But understanding these differences and factoring them into your analysis is critical in properly monitoring and evaluating the effectiveness of your Facebook or Instagram campaigns.
In particular, the fact that mobile apps may remove the referral data when a link is clicked. This can also happen even if you are using UTMs.
As a large amount of Facebook and most Instagram users, will be on the mobile app, clicks from organic posts or ads can be seriously underreported in Google Analytics.
So you need to look at your Direct traffic as well as your referral/social traffic when analysing your social media campaigns.
You should also see the data reported as Facebook / Instagram traffic as a sample set. What you are really looking for is how did the traffic from Facebook behave when they arrived on your site.
This will give you a good idea of the effectiveness of your campaigns.
Session engagement rate, engagement time, and events triggered will give you insights into whether the Facebook visitors were interested/engaged with your content.
User conversion rate & session conversion rate will give you a good idea of the % of the sample set that completed a conversion action.
These metrics should be plenty for you to understand if your Facebook/ Instagram campaigns are effective and targeting the right audience.
And you can compare the data from one campaign with another to see which campaigns are the most effective.
Summary
Hopefully, this article has given you a better understanding of why these differences occur between Facebook and Google Analytics.
If you’re interested to find out more about what has been discussed in the article and much more take a look at one of the short courses listed below:Want to know more about Google Analytics 4 and how to analyse the data - see our GA4 Course
Want to know how to create effective Facebook campaigns see our Facebook course
-

What is Google Analytics? And how can it help my business?
23 Jan 2023Find out about Google Analytics and how it can help your business.
Read More -
Google Analytics 4 Set-Up Checklist
19 Jan 2023Want to know the steps to take to set up Google Analytics 4 correctly? Read this blog...
Read More -

How To Create a GA4 Property
07 Sep 2022Find out how to create your GA4 property with this easy-to-follow guide with either the set-up assistant or doing it manually. In just 5(ish) steps you can have your GA4 property set up and collecting data.
Read More
